Three ways students learn the same idea.
Build fluency through structured instruction, then ask students to demonstrate ownership through visible work and real data.
Guided Direct Instruction
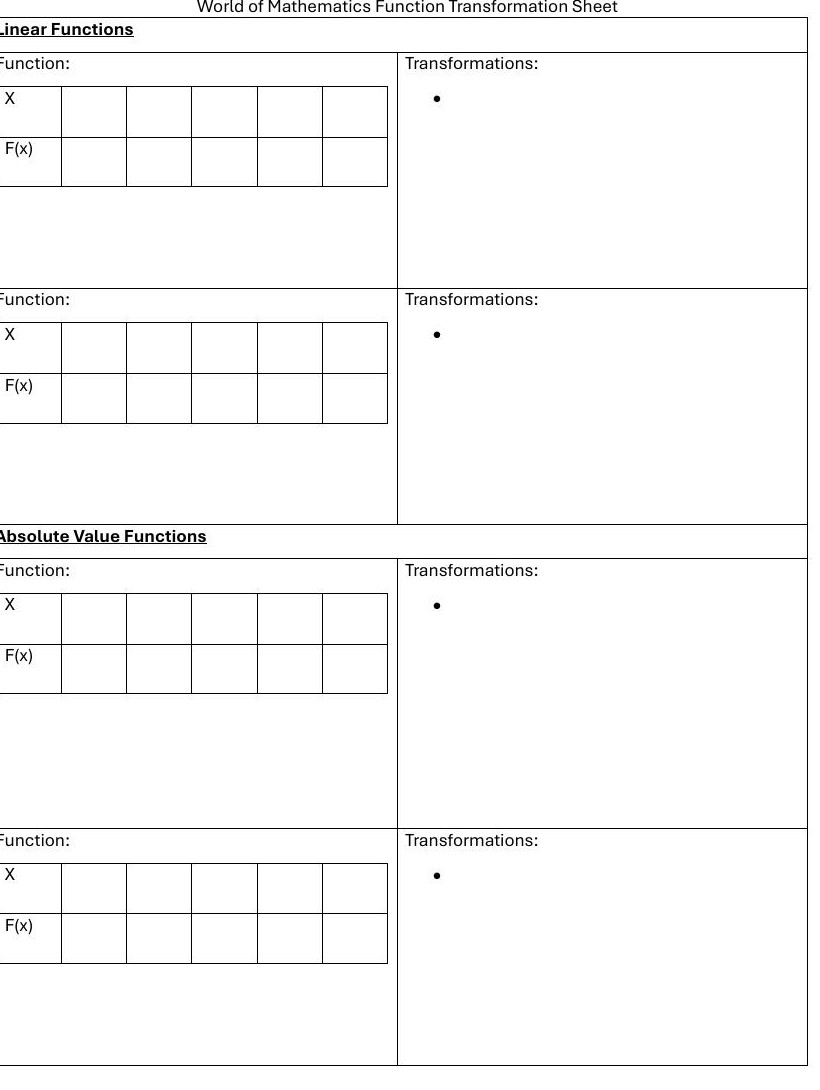
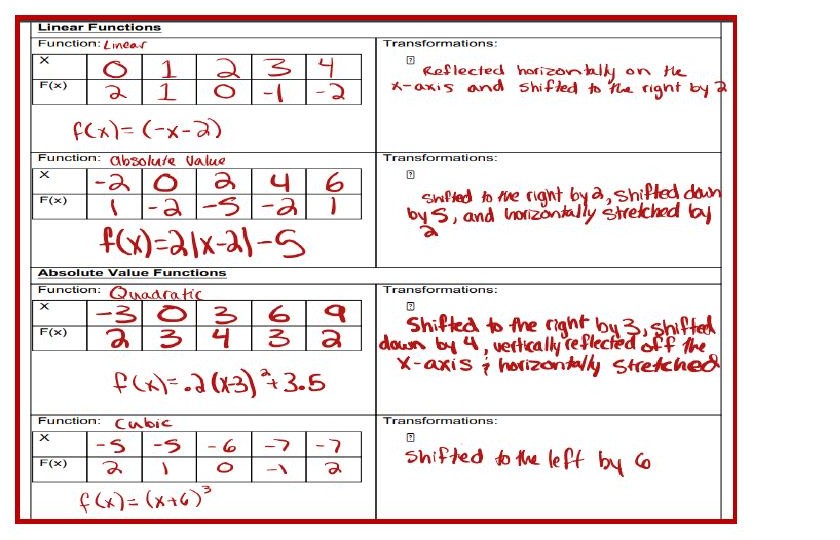
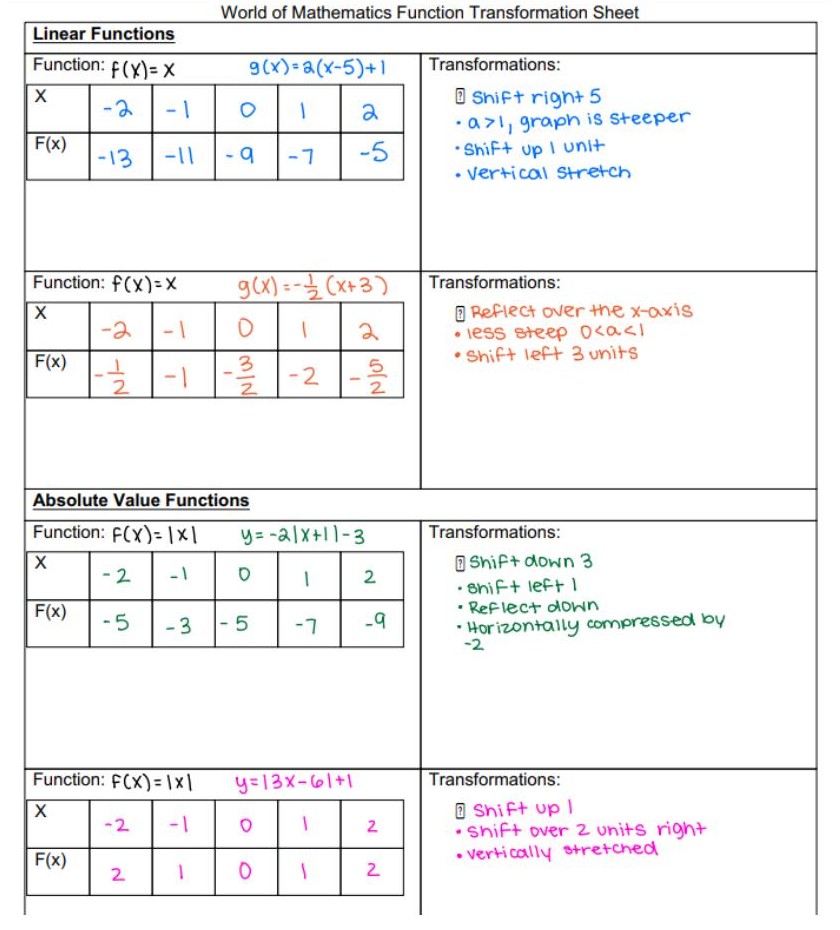
The teacher models one problem completely, thinking out loud. The student is asked a direct question every 60–90 seconds. Scaffolded worksheets keep the same structure: x-values, an f(x) row, and a prompt to name each transformation.
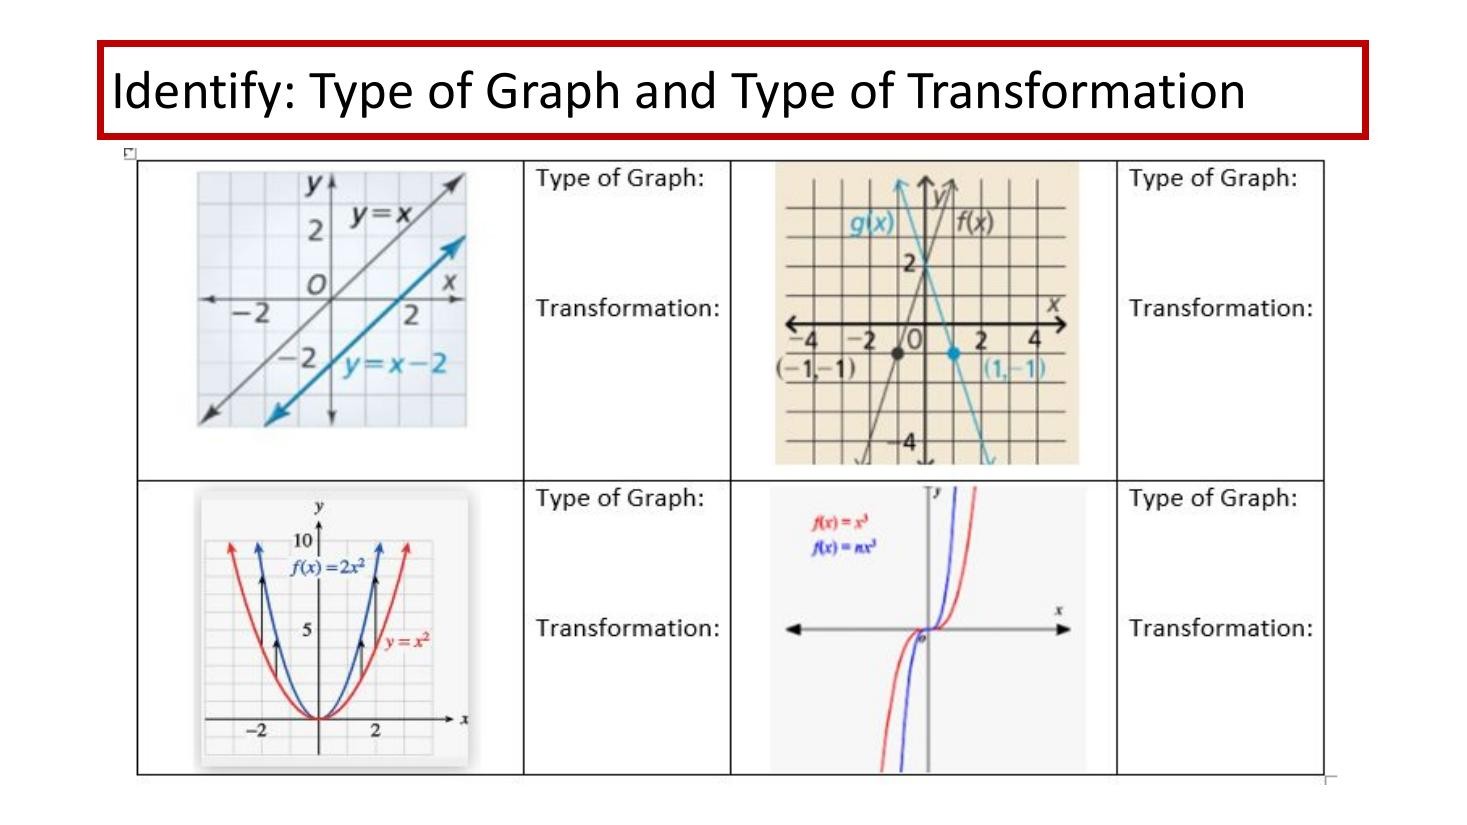
Vocabulary is explicit and repeated: translation, reflection, vertical stretch, vertical compression. Wrong answers are diagnosed on the spot.
It looks like art. It grades like algebra.
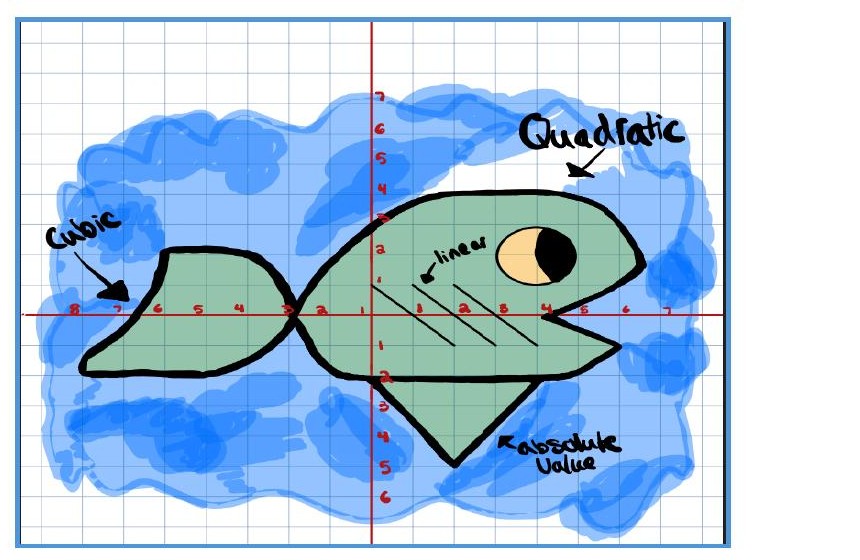
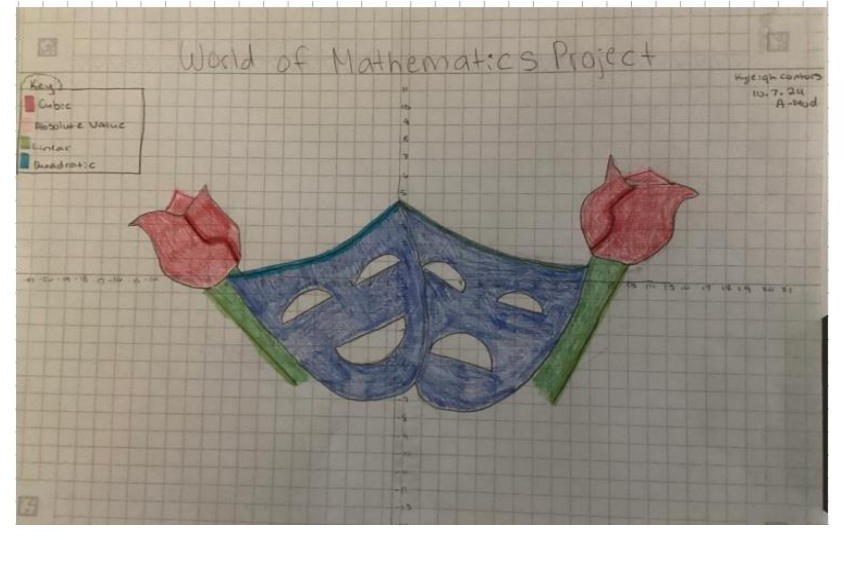
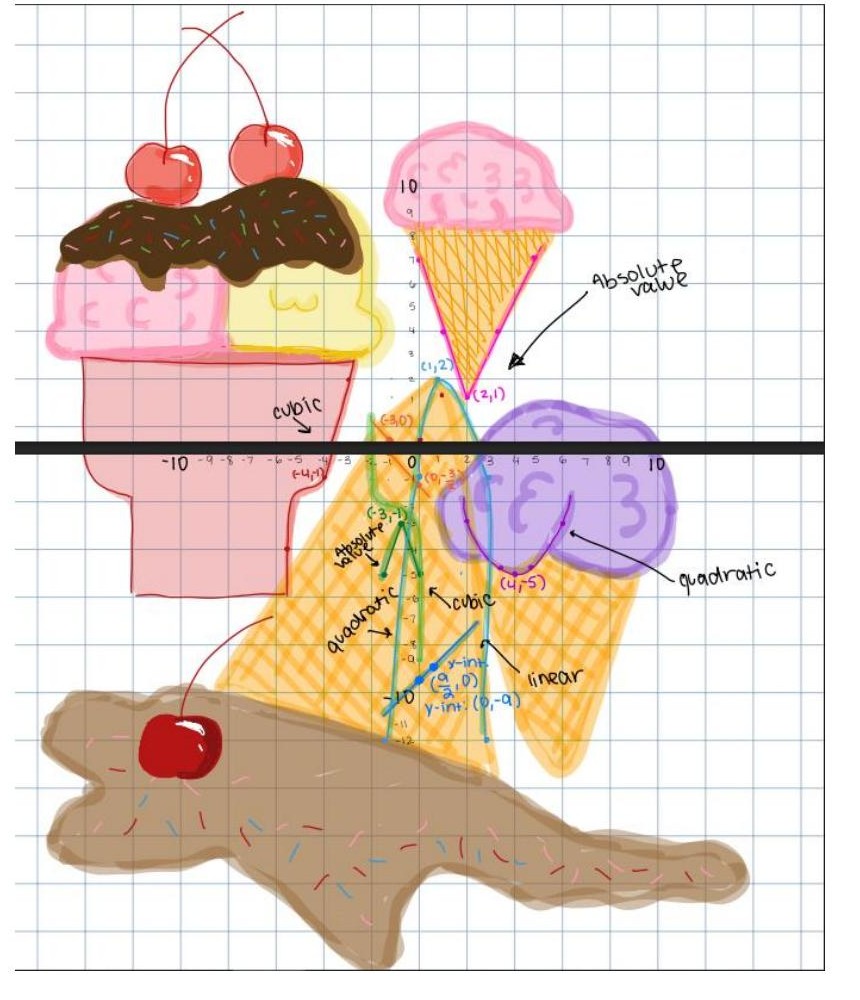
Students design original artwork on graph paper where every line is a function they can defend. The full project includes linear, absolute-value, quadratic, and cubic families plus reflection, translation, and dilation.
Each function requires at least five accurate points, a written equation, and a plain-English description of the transformation. Graphs must be labeled and genuinely connected to the picture.
“Walk It Off” — the full statistics pipeline.
Collect: walk 100 yards, count steps, and measure height in centimeters.
Frame: identify explanatory and response variables.
Plot: hand-build a scatterplot and describe the relationship.
Model: fit the least-squares regression line.
Interpret: explain slope and decide whether the intercept has meaning.
Predict + Validate: predict, compute a residual, build a residual plot, and calculate r².
Strong Body feeds Strong Mind.
Students remember the regression line because they are a point on it.
Examples of visible mathematical thinking.